On Exploding Baseball Payrolls, Inequality, and Revenue Sharing
I recently read Jonah Keri’s The Extra 2%: How Wall Street Strategies Took a Major League Baseball Team from Worst to First, which is a fascinating read about the Tampa Bay Rays and – spoiler alert! – how they went from worst to first using Wall Street strategies.
For those who haven’t read the book, the tl;dr is that against all odds, the Tampa Bay Rays and their miniscule payroll used advanced baseball statistics and new-age strategies to become just as good as – if not sometimes better – than their much richer division rivals, the Yankees and Red Sox. That got me thinking a little bit more about baseball payrolls. The massive gaps between the payrolls of the MLB’s haves and have-nots permeate just about every discussion in baseball, but no one really talks about it. We know all about Jose Molina’s pitch framing and the case for Mike Trout deserving the MVP over Miguel Cabrera, but the analysis of payroll starts and stops in the same place: The Yankees, Red Sox, and Dodgers spend tons of money, while the A’s, Orioles, and Astros don’t.
In fact, finding historical payroll data (at least back to the 1980s) harder than finding how many pitches Old Hoss Radbourn threw in 1881. Thankfully, Lahmann’s Baseball Database finally had the answer.
This article isn’t going to tell us anything revolutionary, but that’s not the point. The point is to put some numbers behind the discussion that all baseball fans have (“PAYROLLS ARE JUST GETTING OUTRAGEOUS” and “OF COURSE, IT’S THE YANKEES SO THEY WILL JUST THROW MONEY AT ANY FREE AGENT THEY SEE”). Of course, those sentiments aren’t necessarily wrong, but if there’s anything a stathead hates, it’s yelling things without citation to back it up.
First up: The explosion of baseball salaries.
Team owners are just throwing around money! Well, yes, they are – but it’s not quite as bad as it sounds. The top payroll in 1985 was the Atlanta Braves’ $14.8 million. In 2013, the Yankees and the Dodgers both shelled out over $200 million. Clearly, salaries have only been getting bigger in the MLB. But before we give ourselves a fever, let’s remember one thing: inflation!
That $14.8 million was almost 30 years ago. When adjusting for inflation, we get that the Braves equivalent spending today would be $21.8 million – or about 50% more than the nominal figure.

Once inflation is adjusted for, the average MLB payroll appears to have grown at a slower rate than at first glance
Payrolls have gone up rapidly, but not quite as fast as the nominal figures lead us to believe. Now there are a lot of reasons for the expansion. For one thing, players have gotten a lot better. They invest more heavily in their skills (through training and conditioning) and their services are worth more. In other words, teams are buying better products. If we want to frame this in economic terms, baseball players have invested more into their human capital, making their usefulness to their company’s product that much better (moar home runz!). That should translate to a higher marginal product, and therefore higher wage.
When Milton Friedman was the bee’s knees in the ’70s, he used to call inflation “too much money chasing too few goods.” That’s probably what the rest of the increase in payrolls is. Thanks to being a government-sanctioned monopoly with increasingly lucrative TV deals and stadium revenue, baseball owners are basically swimming in money like Scrooge McDuck. At the same time, free agents are a finite commodity. If anything, the supply have dwindled in recent years because (spoiler alert: this is what the Rays do in Keri’s book) teams are locking down talent with long-term deals before they reach free agency.
The average baseball payroll has gone up by a factor of five since 1985, while the wage for the average worker in the US has gone up by a little less than half of that:
Who Cares About Average – Let’s Talk About the Big Spenders
Fans of 29 out of the MLB’s 30 teams can agree on one thing: the Yankees spend too much money. Who else would pay $11.5 million for Vernon Wells and his -0.2 WAR in 2013? But it is not just a myth that the Yankees have the fattest wallet in the league. What else would you expect from the most iconic team, in the largest city in the US, with the most lucrative television set-up in baseball? For the last 15 years, the Yankees have led the MLB in payroll.

The Yankees are great at spending money.
In their period of payroll dominance, the Yankees have appeared in 5 World Series, winning 3. Before they took it upon themselves to give massive contracts to men who commission paintings of themselves as centaurs, there was much less consistency at the top of the payroll heap. In fact, a few of the teams we think of as the thriftiest – the Orioles, A’s, and Royals – spent the most in the ‘90s. Now, the Orioles make up problems with players’ MRIs to nullify contracts because they get anxious about how much they were on the hook for.
What’s most interesting is how little correlation between payroll and wins there was prior to 1999. All I’ve known since I was in elementary school in the 90’s is that 1) spending lots of money means lots of wins and 2) the Yankees spend a lot of money. But between 1985 and 1998, that wasn’t the case at all. Outside of 1994 and 1995, which were shortened due to a player’s strike, the team with the top payroll had a losing record 4 out of 12 years (6 out of 14 if you include the shortened seasons). Spending lots of money didn’t use to ensure a playoff appearance like it has since 1999.
Just like the pay of corporate executives, it’s pretty clear that the highest payroll has skyrocketed in the last 25 years. Top payrolls have not just grown rapidly, but they’ve also grown much faster than the lowest payrolls.

Ignoring the noise in the past few years with the lowest payroll (which is due to the Marlins’ spending spree and subsequent selling spree) there’s been a great divergence between the top and bottom payrolls in recent years. The trend has intensified since 2001 (when Richard Clemens became the highest-paid player in the majors with a salary of over $15 million).
In the face of growing inequality, and worries about the competitiveness of small- and medium-sized market teams, the MLB started a revenue sharing program in 1996. Early on, all teams put in a portion of their own revenue, then it was redistributed towards lower revenue teams. The idea was to help teams like the Royals and Twins afford to field good teams, so that the games were exciting and America would keep watching. After a few years, the MLB didn’t like the results it was getting and beefed up the program. In 2002, a reinforced revenue sharing scheme was started, where each team contributed 31% of its revenue instead 20%. Under both plans, the Yankees and Red Sox were essentially transferring cash to the Royals and Twins, but even more in the second version.
You’d expect revenue sharing to reduce the gap between high- and low-payroll teams, but that’s not what happened. In fact, the ratio of lowest-to-highest spending teams has only gotten more unequal since the first revenue sharing plan was put in place. Now, this isn’t a perfect measure because teams are locked into contracts for multiple years, but it nonetheless shows that revenue sharing hasn’t balanced the spending scale in the MLB. The growth in deep-pocketed teams’ ability to spend has far outstripped the amount that gets redistributed through revenue sharing.
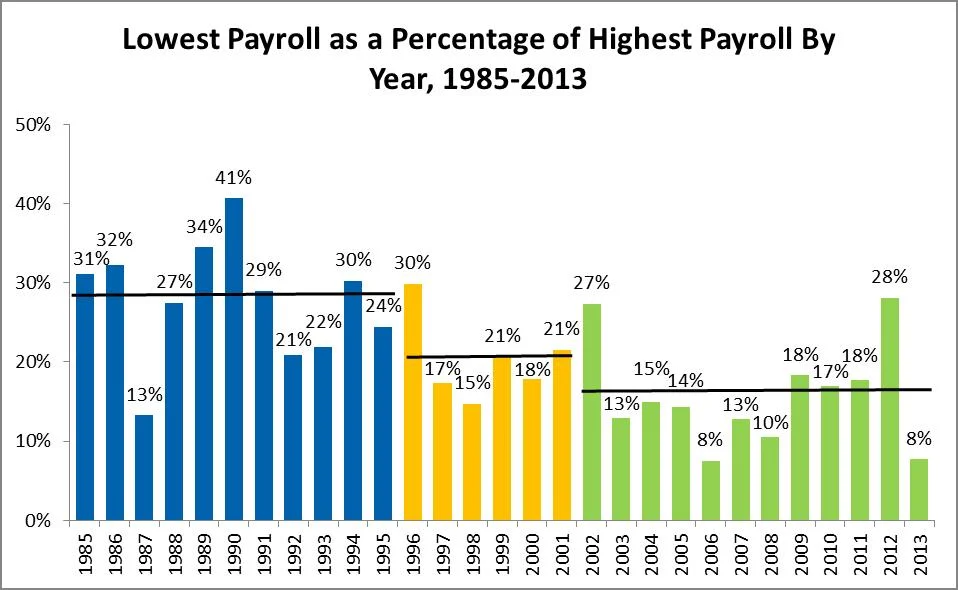
Blue years are prior to revenue sharing. Yellow years are under the first incarnation of revenue sharing. Green bars are under the second, current revenue sharing plan.
Equality in payrolls wasn’t the goal of revenue sharing, however. The goal was to keep a level of competitiveness that would foster the public’s interest in the game. On that goal, the MLB has been mildly successful, but not without a few big buts. For one thing, the teams shelling out beaucoup bucks are still the ones at the top of the standings almost every year. Secondly, the TV viewership of baseball keeps shrinking. The 2013 World Series received ¼ of the share it did in the ‘80s. But there are teams breaking through the payroll barrier every once in a while: The Rays made it to the World Series in 2008 and have been a consistently good team since.
But the Rays are the exception. World Series winners since 1985 have on average had the 8th largest payroll. Every few years a non-top 10 team finds itself with a championship, but not usually.

Only three times has a team outside of the top 20 payroll won the World Series – Minnesota in 1987, Cincinnati in 1990, and Florida in 2003. When the Twins and Cincinnati did it, the Marlins and other recent expansion teams didn’t exist yet, so there were only 26 teams in the league – making them even closer to the bottom. Sometimes a team strikes gold and propels themselves to the Fall Classic on enthusiasm alone, but the bottom feeders shouldn’t think just they’re walking into a World Series ring any time soon.
So what does this tell us about MLB payrolls? It pretty much confirms what most people think already: payrolls keep getting bigger, poor teams almost never win the World Series, and the Yankees spend more than anybody else.
The most surprising bit is the apparent uselessness of revenue sharing to stem the tide of inequality across the league. Teams are increasingly priced out of the free agent market because the top ten teams are willing to gamble much more money on a contract, since the cash would around doing nothing else otherwise. Whether there is a good solution to this a difficult question. More difficult is how much equality there should be. Even harder yet is whether any solution would be endorsed by the league and its owners. For now, maybe sabrmetrics is the great equalizer, as it was in The Extra 2% and Moneyball.